RocketMQ Prometheus Exporter
Introduction
Rocketmq-exporter is a system for monitoring all relevant metrics of the RocketMQ broker and client sides, which packages the metric values obtained from the broker side through mqAdmin into 87 caches.
In previous versions, there were 87 concurrentHashMaps, but since the Map does not delete expired metrics, once there is a label change, a new metric is generated and the old, unused metric cannot be automatically deleted, which eventually causes a memory overflow. However, using the Cache structure can enable expired deletion, and the expiration time can be configured.
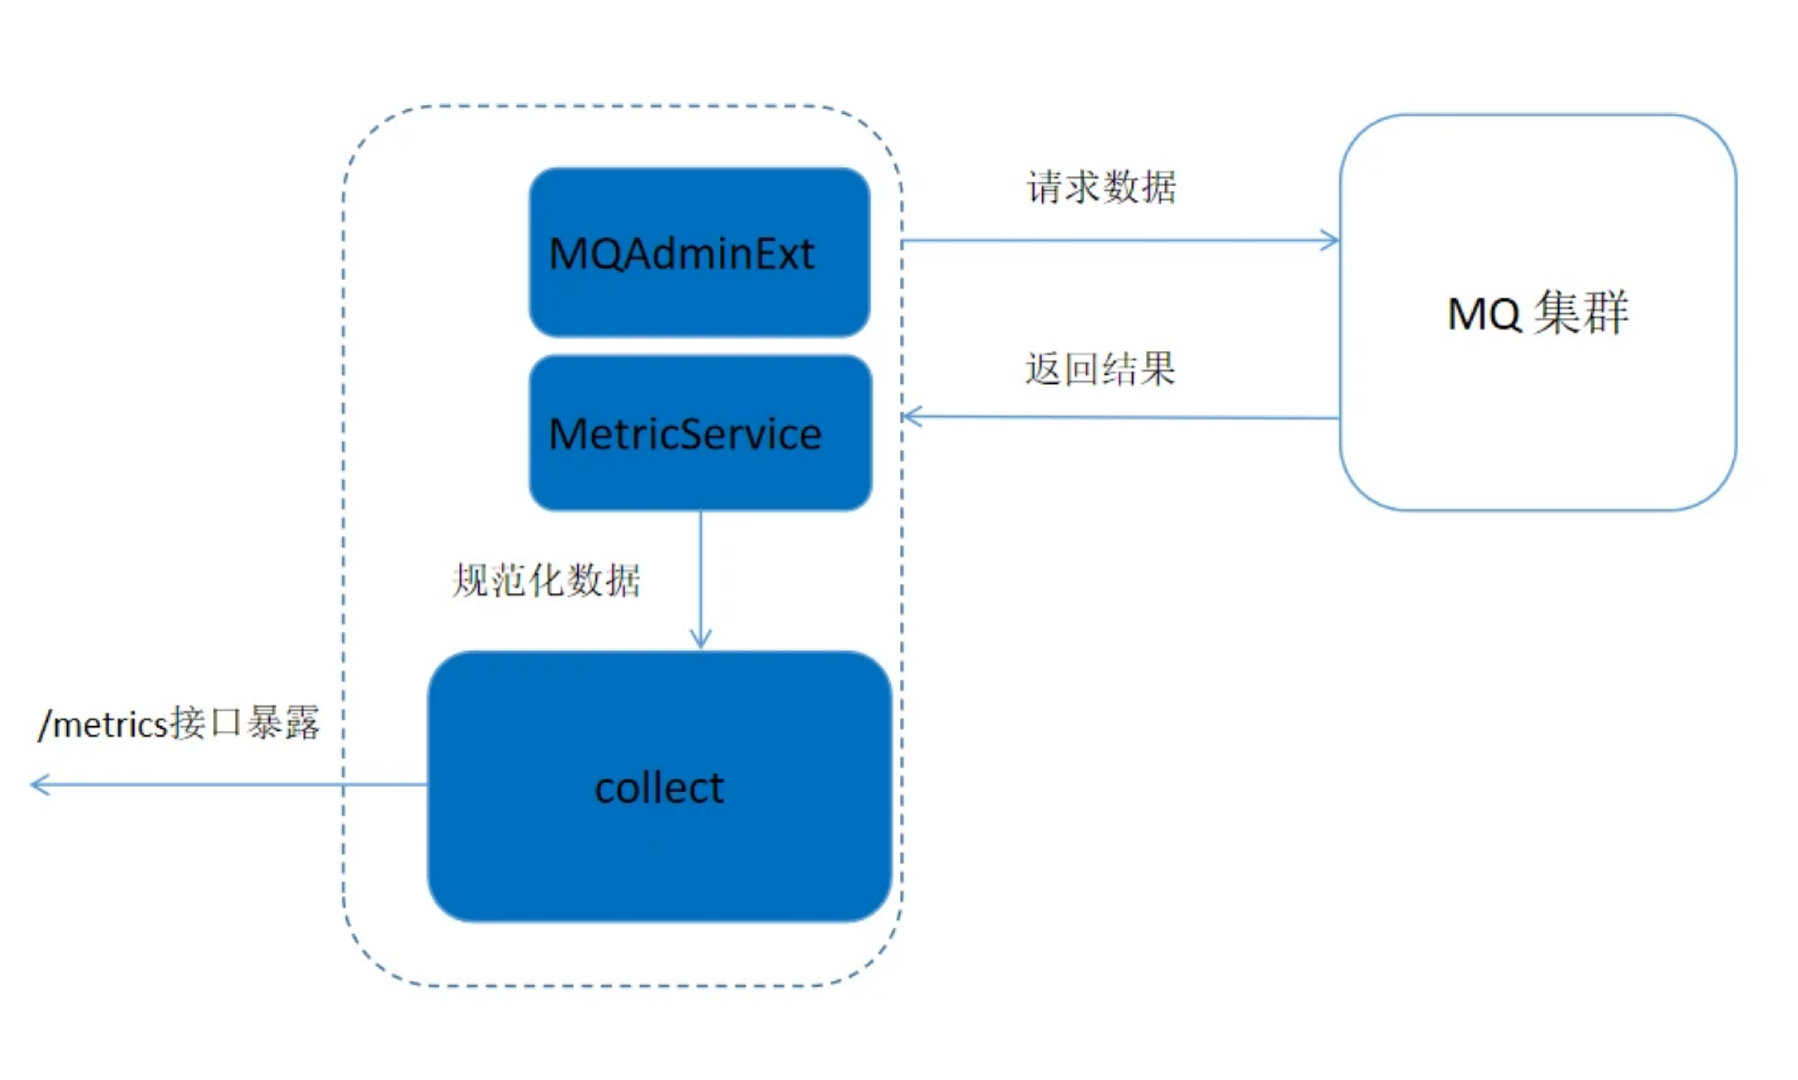
The process for Rocketmq-exporter to obtain monitoring metrics is shown in the following figure. The exporter requests data from the MQ cluster through MQAdminExt, and the requested data is standardized into the format required by Prometheus through the MetricService, and then exposed to Prometheus through the /metrics interface.
Metric structure
The Metric class is located in the org.apache.rocketmq.exporter.model.metrics package, and is essentially a set of entity classes, with each entity class representing a type of metric, for a total of 14 Metric classes. These classes serve as the keys for the 87 caches and are distinguished by different label values.
- Metric classes related to the broker : BrokerRuntimeMetric、BrokerMetric、DLQTopicOffsetMetric、TopicPutNumMetric
- Consumer-related classes : ConsumerRuntimeConsumeFailedMsgsMetric 、ConsumerRuntimeConsumeFailedTPSMetric 、ConsumerRuntimeConsumeOKTPSMetric、ConsumerRuntimeConsumeRTMetric、ConsumerRuntimePullRTMetric、ConsumerRuntimePullTPSMetric、ConsumerCountMetric、ConsumerMetric、ConsumerTopicDiffMetric
- Producer-related metric classes: ProducerMetric
Prometheus pulls metrics
The RocketMQ-exporter project and Prometheus are equivalent to the server-client relationship, where the RocketMQ-exporter project introduces the Prometheus client package, which specifies the type of information to be obtained in the project's MetricFamilySamples class. Prometheus requests metrics from exporter, and exporter returns the information to Prometheus after packaging it into the corresponding type.
After the rocketmq-exporter project is started, it will collect various metrics from rocketmq into the mfs object. When the browser or Prometheus accesses the corresponding interface, the samples in the mfs object will be generated into the formatted data supported by Prometheus through the service. It mainly includes the following steps:
The browser accesses ip:5557/metrics to call the metrics method in the RMQMetricsController class, where ip is the IP of the host where the rocketmq-exporter project is running.
private void metrics(HttpServletResponse response) throws IOException {
    StringWriter writer = new StringWriter();
    metricsService.metrics(writer);
    response.setHeader("Content-Type", "text/plain; version=0.0.4; charset=utf-8");
    response.getOutputStream().print(writer.toString());
}
By creating a new StringWriter object to collect metric indicators, the metrics in the exporter are collected into the writer object through the metrics method in the MetricsService class, and then the collected indicators are output to the webpage.
The format of the collected metrics is:
<metric name>{<label name>=<label value>, ...} <metric value>
Example:
rocketmq_group_diff{group="rmq_group_test_20220114",topic="fusion_console_tst",countOfOnlineConsumers="0",msgModel="1",} 23.0
The 5 scheduled tasks in the MetricCollectTask class
The MetricCollectTask class has five scheduled tasks: collectTopicOffset, collectConsumerOffset, collectBrokerStatsTopic, collectBrokerStats, and collectBrokerRuntimeStats. They are used to collect consumer offset information and Broker state information, etc. Its cron expression is: cron: 15 0/1 * * * ?, which means it will collect once per minute. Its core function is to obtain information from the broker in the cluster through the mqAdminExt object and then add it to the corresponding 87 monitoring indicators, taking collectTopicOffset as an example:
First, initialize the TopicList object and obtain all topic information in the cluster through the mqAdminExt.fetchAllTopicList() method.
TopicList topicList = null;
try {
    topicList = mqAdminExt.fetchAllTopicList();
} catch (Exception ex) {
        log.error(String.format("collectTopicOffset-exception comes getting topic list from namesrv, address is %s",
            JSON.toJSONString(mqAdminExt.getNameServerAddressList())));
        return;
}
Add the topic to the topicSet, and iterate through each topic, checking the topic status through the mqAdminExt.examineTopicStats(topic) function.
Set < String > topicSet = topicList != null ? topicList.getTopicList() : null;
for (String topic: topicSet) {
     TopicStatsTable topicStats = null;
     try {
         topicStats = mqAdminExt.examineTopicStats(topic);
     } catch (Exception ex) {
         log.error(String.format("collectTopicOffset-getting topic(%s) stats error. the namesrv address is %s",
             topic,
             JSON.toJSONString(mqAdminExt.getNameServerAddressList())));
         continue;}
Initialize the topic status set, the hash table brokerOffsetMap for topic information offset divided by broker, and a hash table brokerUpdateTimestampMap with broker name as the key to store the update timestamp.
Set<Map.Entry<MessageQueue, TopicOffset>> topicStatusEntries = topicStats.getOffsetTable().entrySet();
HashMap<String, Long> brokerOffsetMap = new HashMap<>();
HashMap<String, Long> brokerUpdateTimestampMap = new HashMap<>();
for (Map.Entry<MessageQueue, TopicOffset> topicStatusEntry : topicStatusEntries) {
    MessageQueue q = topicStatusEntry.getKey();
    TopicOffset offset = topicStatusEntry.getValue();
    if (brokerOffsetMap.containsKey(q.getBrokerName())) {
        brokerOffsetMap.put(q.getBrokerName(), brokerOffsetMap.get(q.getBrokerName()) + offset.getMaxOffset());
    } else {
        brokerOffsetMap.put(q.getBrokerName(), offset.getMaxOffset());
    }
    if (brokerUpdateTimestampMap.containsKey(q.getBrokerName())) {
        if (offset.getLastUpdateTimestamp() > brokerUpdateTimestampMap.get(q.getBrokerName())) {
            brokerUpdateTimestampMap.put(q.getBrokerName(), offset.getLastUpdateTimestamp());
        }
    } else {
        brokerUpdateTimestampMap.put(q.getBrokerName(),
        offset.getLastUpdateTimestamp());
    }
}
Finally, by iterating through each item in the brokerOffsetMap, the metricCollector object is obtained through the metricsService and the addTopicOffsetMetric method in the RMQMetricsCollector class is called to add the corresponding value to one of the caches of the 87 metrics in the RMQMetricsCollector class.
 Set<Map.Entry<String, Long>> brokerOffsetEntries = brokerOffsetMap.entrySet();
        for (Map.Entry<String, Long> brokerOffsetEntry : brokerOffsetEntries) {
            metricsService.getCollector().addTopicOffsetMetric(clusterName, brokerOffsetEntry.getKey(), topic,
                brokerUpdateTimestampMap.get(brokerOffsetEntry.getKey()), brokerOffsetEntry.getValue());
        }
    }
    log.info("topic offset collection task finished...." + (System.currentTimeMillis() - start));
}
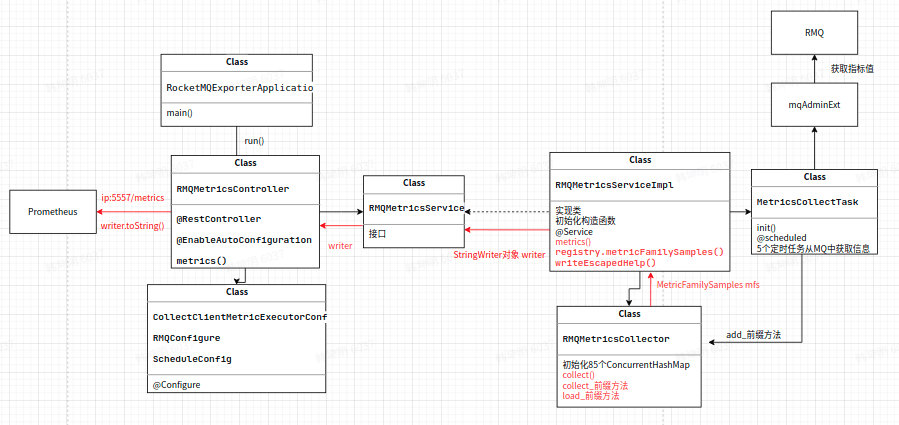
Rocketmq-exporter collects metrics flowchart
Quick star
Configure application.yml
Important configurations in application.yml include:
server.port sets the port that Prometheus listens to for the rocketmq-exporter, with a default value of 5557.
rocketmq.config.webTelemetryPath configures the path for Prometheus to obtain metrics, with a default value of /metrics. The default value can be used.
rocketmq.config.enableACL If the RocketMQ cluster has enabled ACL verification, it needs to be set to true and the corresponding ak and sk need to be configured in accessKey and secretKey.
rocketmq.config.outOfTimeSeconds is used to configure the expiration time of storing metrics and their values. If it exceeds this time and the key in the cache has not undergone a write change, it will be deleted. Generally, it can be configured as 60s (the time interval for Prometheus to obtain metrics should be reasonably configured according to the expiration time, as long as the expiration time is greater than or equal to the time interval for Prometheus to collect metrics).
task..cron configures the time interval for the exporter to pull metrics from the broker through a scheduled task, with a default value of "15 0/1 * * ?" which means it will pull metrics every 15s of every minute.
Start exporter application
Start Prometheus according to the configuration on its official website
Configure Prometheus's static_config: -targets to the exporter's starting IP and port, such as: localhost:5557.
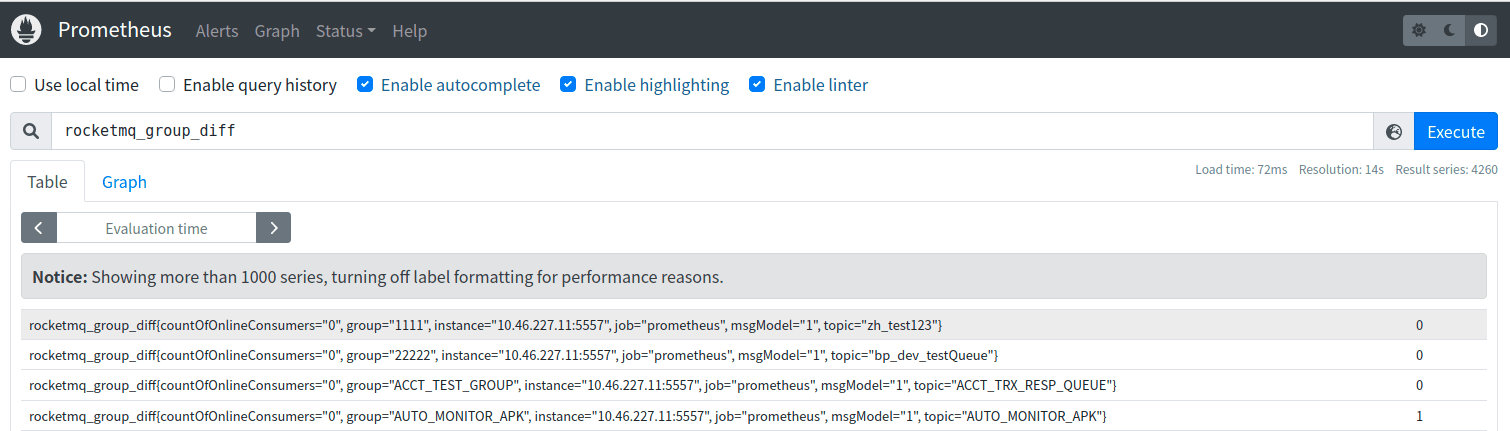
Access the Prometheus page
If the localhost starts at the default localhost:9090, you can view the collected metric values, as shown in the following figure:
For better visualization effects and to observe the trend of metric value changes, Prometheus is better used with Grafana!
Observability metrics
Observability metrics mainly include two categories: server-side metrics and client-side metrics. Server-side metrics are directly generated by the server, and client-side metrics are generated on the client and obtained by the server through an RPC request to the client. Client-side metrics can be further divided into producer metrics and consumer metrics. All 87 observability metrics and their main meanings are as follows:
Server metrics
Server metrics
| Metrics name | Definition | Corresponds to Broker metric name |
|---|---|---|
| rocketmq_broker_tps | Broker-level production TPS | |
| rocketmq_broker_qps | Broker-level consumption QPS | |
| rocketmq_broker_commitlog_diff | Broker group synchronization behind message size from slave node | |
| rocketmq_brokeruntime_pmdt_0ms | Server-side processing time for write request to completion of write(0ms) | putMessageDistributeTime |
| rocketmq_brokeruntime_pmdt_0to10ms | Server-side processing time for write request to completion of write(0~10ms) | |
| rocketmq_brokeruntime_pmdt_10to50ms | Server-side processing time for write request to completion of write(10~50ms) | |
| rocketmq_brokeruntime_pmdt_50to100ms | Server-side processing time for write request to completion of write(50~100ms) | |
| rocketmq_brokeruntime_pmdt_100to200ms | Server-side processing time for write request to completion of write(100~200ms) | |
| rocketmq_brokeruntime_pmdt_200to500ms | Server-side processing time for write request to completion of write(200~500ms) | |
| rocketmq_brokeruntime_pmdt_500to1s | Server-side processing time for write request to completion of write(500~1000ms) | |
| rocketmq_brokeruntime_pmdt_1to2s | Server-side processing time for write request to completion of write(1~2s) | |
| rocketmq_brokeruntime_pmdt_2to3s | Server-side processing time for write request to completion of write(2~3s) | |
| rocketmq_brokeruntime_pmdt_3to4s | Server-side processing time for write request to completion of write(3~4s) | |
| rocketmq_brokeruntime_pmdt_4to5s | Server-side processing time for write request to completion of write(4~5s) | |
| rocketmq_brokeruntime_pmdt_5to10s | Server-side processing time for write request to completion of write(5~10s) | |
| rocketmq_brokeruntime_pmdt_10stomore | Server-side processing time for write request to completion of write(> 10s) | |
| rocketmq_brokeruntime_dispatch_behind_bytes | The number of bytes of messages that have not been distributed yet (operations such as building indexes) | dispatchBehindBytes |
| rocketmq_brokeruntime_put_message_size_total | The total sum of the sizes of messages written to the broker | putMessageSizeTotal |
| rocketmq_brokeruntime_put_message_average_size | The average size of messages written to the broker | putMessageAverageSize |
| rocketmq_brokeruntime_remain_transientstore_buffer_numbs | The capacity of the queue in the TransientStorePool | remainTransientStoreBufferNumbs |
| rocketmq_brokeruntime_earliest_message_timestamp | The earliest timestamp of the messages stored by the broker | earliestMessageTimeStamp |
| rocketmq_brokeruntime_putmessage_entire_time_max | The maximum time it took to write messages to the broker since it started running | putMessageEntireTimeMax |
| rocketmq_brokeruntime_start_accept_sendrequest_time | The time at which the broker started accepting send requests | startAcceptSendRequestTimeStamp |
| rocketmq_brokeruntime_putmessage_times_total | The total number of times messages were written to the broker | putMessageTimesTotal |
| rocketmq_brokeruntime_getmessage_entire_time_max | The maximum time it took to process message pulls since the broker started running | getMessageEntireTimeMax |
| rocketmq_brokeruntime_pagecache_lock_time_mills | pageCacheLockTimeMills | |
| rocketmq_brokeruntime_commitlog_disk_ratio | The usage ratio of the disk where the commitLog is located | commitLogDiskRatio |
| rocketmq_brokeruntime_dispatch_maxbuffer | A value that the broker has not calculated and remains at 0 | dispatchMaxBuffer |
| rocketmq_brokeruntime_pull_threadpoolqueue_capacity | The capacity of the thread pool queue for processing pull requests. | pullThreadPoolQueueCapacity |
| rocketmq_brokeruntime_send_threadpoolqueue_capacity | Capacity of the queue in the thread pool handling pull requests | sendThreadPoolQueueCapacity |
| rocketmq_brokeruntime_query_threadpool_queue_capacity | Capacity of the queue in the thread pool handling query requests | queryThreadPoolQueueCapacity |
| rocketmq_brokeruntime_pull_threadpoolqueue_size | Actual size of the queue in the thread pool handling pull requests | pullThreadPoolQueueSize |
| rocketmq_brokeruntime_query_threadpoolqueue_size | Actual size of the queue in the thread pool handling query requests | queryThreadPoolQueueSize |
| rocketmq_brokeruntime_send_threadpool_queue_size | Actual size of the queue in the thread pool handling send requests | sendThreadPoolQueueSize |
| rocketmq_brokeruntime_pull_threadpoolqueue_headwait_timemills | Waiting time for the head task in the queue in the thread pool handling pull requests | pullThreadPoolQueueHeadWaitTimeMills |
| rocketmq_brokeruntime_query_threadpoolqueue_headwait_timemills | Waiting time for the head task in the queue in the thread pool handling query requests | queryThreadPoolQueueHeadWaitTimeMills |
| rocketmq_brokeruntime_send_threadpoolqueue_headwait_timemills | Waiting time for the head task in the queue in the thread pool handling send requests | sendThreadPoolQueueHeadWaitTimeMills |
| rocketmq_brokeruntime_msg_gettotal_yesterdaymorning | Total number of times messages were read up until midnight last night | msgGetTotalYesterdayMorning |
| rocketmq_brokeruntime_msg_puttotal_yesterdaymorning | Total number of times messages were written up until midnight last night | msgPutTotalYesterdayMorning |
| rocketmq_brokeruntime_msg_gettotal_todaymorning | Total number of times messages were read up until midnight tonight | msgGetTotalTodayMorning |
| rocketmq_brokeruntime_msg_puttotal_todaymorning | Total number of times messages were written up until midnight tonight | putMessageTimesTotal |
| rocketmq_brokeruntime_msg_put_total_today_now | The number of messages written to each broker so far. | msgPutTotalTodayNow |
| rocketmq_brokeruntime_msg_gettotal_today_now | The number of messages read from each broker so far. | msgGetTotalTodayNow |
| rocketmq_brokeruntime_commitlogdir_capacity_free | The available space in the directory where the commitLog are stored. | commitLogDirCapacity |
| rocketmq_brokeruntime_commitlogdir_capacity_total | The total space in the directory where the commit logs are stored. | |
| rocketmq_brokeruntime_commitlog_maxoffset | The maximum offset of the commitLog. | commitLogMaxOffset |
| rocketmq_brokeruntime_commitlog_minoffset | The minimum offset of the commitLog. | commitLogMinOffset |
| rocketmq_brokeruntime_remain_howmanydata_toflush | remainHowManyDataToFlush | |
| rocketmq_brokeruntime_getfound_tps600 | The average TPS of messages received during getMessage in the past 600 seconds. | getFoundTps |
| rocketmq_brokeruntime_getfound_tps60 | The average TPS of messages received during getMessage in the past 60 seconds. | |
| rocketmq_brokeruntime_getfound_tps10 | The average TPS of messages received during getMessage in the past 10 seconds. | |
| rocketmq_brokeruntime_gettotal_tps600 | The average TPS of getMessage calls in the past 600 seconds. | getTotalTps |
| rocketmq_brokeruntime_gettotal_tps60 | The average TPS of getMessage calls in the past 60 seconds. | |
| rocketmq_brokeruntime_gettotal_tps10 | The average TPS of getMessage calls in the past 10 seconds. | |
| rocketmq_brokeruntime_gettransfered_tps600 | getTransferedTps | |
| rocketmq_brokeruntime_gettransfered_tps60 | ||
| rocketmq_brokeruntime_gettransfered_tps10 | ||
| rocketmq_brokeruntime_getmiss_tps600 | Average TPS for getMessage with no messages obtained in the past 600 seconds | getMissTps |
| rocketmq_brokeruntime_getmiss_tps60 | Average TPS for getMessage with no messages obtained in the past 60 seconds | |
| rocketmq_brokeruntime_getmiss_tps10 | Average TPS for getMessage with no messages obtained in the past 10 seconds | |
| rocketmq_brokeruntime_put_tps600 | Average TPS for message write operations in the past 600 seconds | putTps |
| rocketmq_brokeruntime_put_tps60 | Average TPS for message write operations in the past 60 seconds | |
| rocketmq_brokeruntime_put_tps10 | Average TPS for message write operations in the past 10 seconds |
Producer metrics
Producer metrics
| Metrics name | Definition |
|---|---|
| rocketmq_producer_offset | The maximum offset of the topic at the current time |
| rocketmq_topic_retry_offset | The maximum offset of the retry topic at the current time |
| rocketmq_topic_dlq_offset | The maximum offset of the dead letter topic at the current time |
| rocketmq_producer_tps | The production TPS of the topic on a Broker group |
| rocketmq_producer_message_size | The TPS of the production message size of the topic on a Broker group |
| rocketmq_queue_producer_tps | Queue-level production TPS |
| rocketmq_queue_producer_message_size | Queue-level production TPS of message size |
Consumer metrics
Consumer metrics
| Metrics name | Definition |
|---|---|
| rocketmq_group_diff | Consumer group message accumulation message count |
| rocketmq_group_retrydiff | Consumer group retry queue accumulation message count |
| rocketmq_group_dlqdiff | Consumer group dead letter queue accumulation message count |
| rocketmq_group_count | Number of consumers in the consumer group |
| rocketmq_client_consume_fail_msg_count | Number of times consumers in the consumer group have failed to consume in the past 1 hour |
| rocketmq_client_consume_fail_msg_tps | Consumer group consumer failure TPS |
| rocketmq_client_consume_ok_msg_tps | Consumer group consumer success TPS |
| rocketmq_client_consume_rt | Time taken for a message to be consumed after it has been pulled |
| rocketmq_client_consumer_pull_rt | Time taken for a client to pull a message |
| rocketmq_client_consumer_pull_tps | Client pull message TPS |
| rocketmq_consumer_tps | Consumption TPS of subscription group on each Broker group |
| rocketmq_group_consume_tps | Current consumption TPS of subscription group (aggregated by broker for rocketmq_consumer_tps) |
| rocketmq_consumer_offset | The current consumption Offset of the subscription group in a broker group |
| rocketmq_group_consume_total_offset | The current consumption Offset of the subscription group (aggregated by broker for rocketmq_consumer_offset) |
| rocketmq_consumer_message_size | The TPS of the subscription group consuming message size in a broker group |
| rocketmq_send_back_nums | The number of times the subscription group in a broker group has failed to consume and written to the retry message |
| rocketmq_group_get_latency_by_storetime | The consumption delay of the consumer group, the difference between the current time and when the exporter gets the message. |